 Being an online social butterfly for your business is great, especially if you’ve developed a knack for it. By writing blog posts and sharing them to Twitter or posting images of the latest employee event on Facebook, you’ve created a great way to engage with your audience. But when it comes to measuring all that engagement, how do you do it?
Let’s go over a few of the sites that small businesses may use.
Twitter Analytics
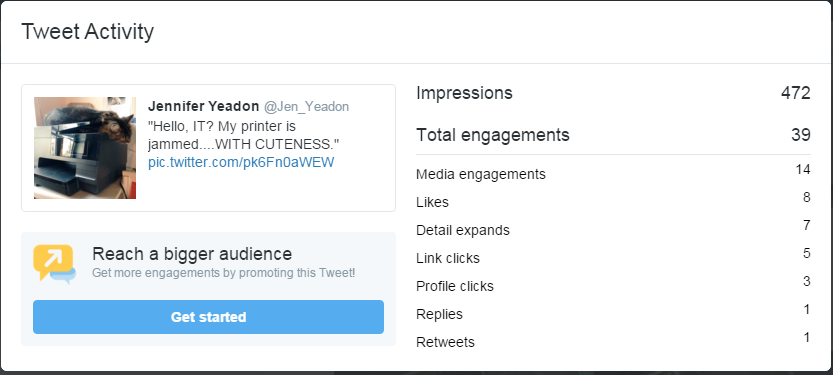
Looking at the tweet below, you can see that it has one retweet and 8 likes. But how many times did people see or engage with it, but not retweet or like it? You can find this out by clicking the three lines that look like a bar graph.

When you click on that bar graph icon, it will bring up a brief glimpse of that tweet’s activity. Here are some terms to get familiar with:
Impressions: This is an estimate of the number of times people saw your tweet.
Total Engagements: The total number of times users interacted with the tweet.

To get even more in-depth analytics over time, including a report for the month of your top tweet, most popular follower, top mention, number of profile visits, tweets, impressions and more, you can access your full Twitter analytics report at Twitter Analytics.
Facebook Insights
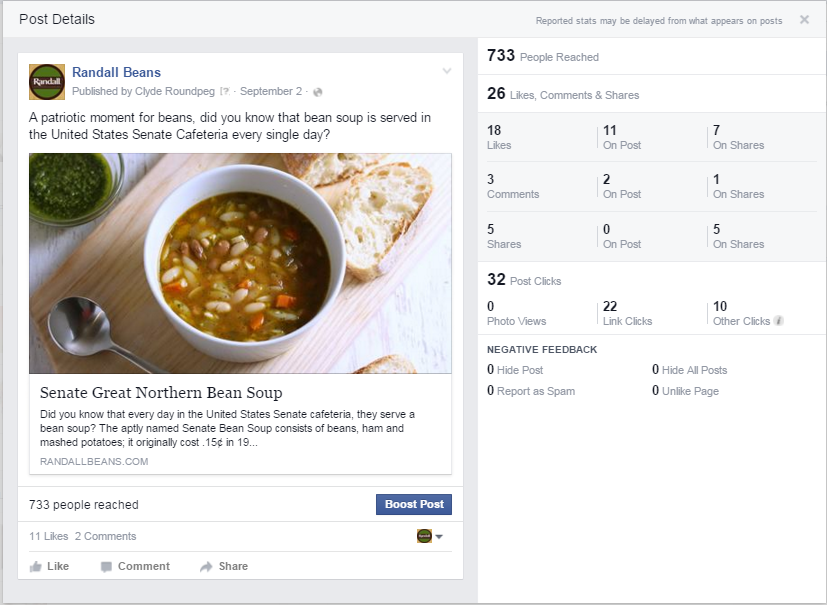
Facebook makes it easy to check how popular your posts are. You can see the post below got 11 likes and 2 comments, but also that it reached a larger audience with 733 people reached.

If you click on the number of people reached, you can pull up a report about the post, called Post Details. It gives you a great breakdown of the number of likes, both from your followers and your followers’ followers, the number of shares and a breakdown of clicks. There’s also a negative feedback field, where you can see how many people hid just this post, or all posts, unliked your page or marked it as spam.
Negative feedback is not good, but it does give you a pretty decent idea of what you should and should not post.

LinkedIn Analytics
LinkedIn is another important site for small businesses that gives an analytics breakdown that can prove helpful. To get there, go to your business page and click on the second tab after home, Analytics.

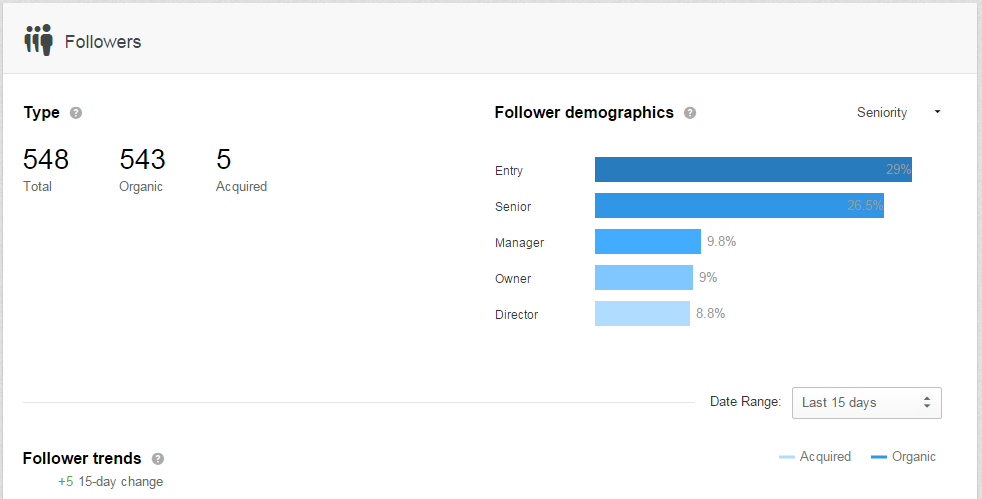
Once in the dashboard, you can see how well your updates are doing, how many impressions they got and followers that you acquired from them. You can also see a line graph of reach and engagement, the demographics of your followers and visitors, as well as how you compare to similar businesses.

Social Media Metrics in One Place
Now I see you thinking, “Geez, it’s going to take forever to visit all those sites”. Good news! There are several platforms that make it easy to see all of your social metrics in one place. A great one that we use at Roundpeg is called Dasheroo. It gives you a dashboard where you can choose from hundreds of different metrics, for sites like Constant Contact, Google Analytics, Formstack and Pinterest. Other sites you can use to track social media metrics include Woopra, Sprout Social, True Social Metrics and Buffer.
The real value in tracking metrics comes not just from a few numbers on the page, but deciding what your goals will be, assessing the metrics and making decisions as to which platform your business should focus on. Some of your content will get a lot of clicks and some will bomb – pay attention to these stats to see which content you should be creating more of.
If you want to learn how to track even more metrics, check out this Marketing Metrics webinar.

