Facebook Metrics

I love numbers. Actually, I like them so well I was going to be an accountant until one of my professors explained that good marketing is all about the numbers.
Today, as we build marketing strategies for clients, there is a focus on the numbers. All the activity for our clients is great, writing blog posts and social media updates, but the real measure of success is the numbers. So I get really excited when I see numbers especially Facebook metrics that tell me what we are doing is working for our clients.
Unfortunately, many of our clients don’t live and breath marketing numbers so they may not share my enthusiasm when they receive their monthly results.
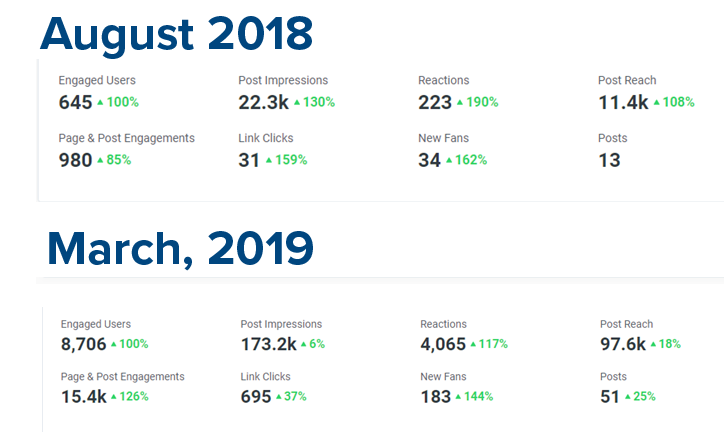
That was definitely the case recently. We sent a client the before and after comparison of their Facebook metrics that you see below. These are incredible results and we were ecstatic, but the client wasn’t impressed. Why? Because they didn’t understand what the numbers meant.
So I wrote an explanation of each Facebook metric. Then they were impressed. So if the numbers don’t tell you the whole story, read the rest of my notes below the data.

Impressions Aug: 22,300 March: 173,200
Impressions are the number of times a post from your page is displayed. If, for example, someone sees a page update in their Facebook news feed and then sees that same update when a friend shares it, that would count as 2 impressions.
Why do impressions matter? Most people need to be exposed to a message, product, or brand multiple times before it becomes memorable. Whether you are launching a new company or simply running a sale on your most popular product, multiple impressions help you break through the clutter and get noticed.
In this case, our campaign made 8 times as many impressions as the client typically had before we started working with them.
Reach Aug: 11,400 March: 97,600
This is the number of unique people who received impressions of a post. As Facebook has made it more and more difficult to reach an audience, this growth is extraordinary. We did spend about $100/month to expand our reach, but as you will see from the engagement numbers below most of the reach came as people liked and shared the content we were presenting.
Page and Post Engagement Aug: 980 March: 15,400
This engagement metric looks at the total number of interactions with your content. It is obvious that fans are responding multiple times within a month, liking and sharing several pieces of content.
Engaged User Aug: 645 March: 8,706
This metric provides an understanding of how well content is performing. It is the number of unique people who responded to something that you have posted. Engagement includes any click, reaction (like, love, laugh) comment or share.
Why is it important? The more people who engage with content, the more value Facebook will put on the information you are sharing, and the more likely it will be that your next post will be presented to a wider audience.
Reactions Aug: 223 March: 4,065
Reactions are Facebook’s way of facilitating that emotional conversation online. Facebook Reactions are a series of 6 emojis customers can use to respond to a post. The options include: Love, Ha-ha, Like, Wow, Sad, and Angry. This metric is a subset of the engagement metric, describing a very specific type of interaction.
Like engagement overall, Facebook reads reactions as a signal that you are providing information people will like to see. Also, studying your reaction data will help you figure out which types of content to share more of.
Link Clicks Aug: 31 March: 695
This is probably the strongest of all the metrics. It defines the number of times a link in a post is clicked. Why is this the strongest metric? Because the viewer is engaging with the content to take the next step. They are agreeing to be transported to a specified destination or experience, on or off Facebook-owned properties. For example, if someone clicks on a buy now button they will be taken to a website or app store, we report this click as a link click.
New Fans Aug: 31 March: 183
This is the number of new people who have joined your community. This is usually the metric everyone focus on. How many fans do you have? While it is nice to have a bigger community, if people aren’t engaging with your content it won’t really matter.
The trick is to get your house in order. Create great content, then invite lots of people to see it. As new people are exposed, through shares by their friends, remember to invite them to join your page as well.
Posts Aug: 13 March: 51
This is the number of status updates made during the month. It is a measure of how consistently the page is being updated. For this client, an arts organization, it makes sense to be posting up to twice a day, sharing event announcements and photos from events.
For most businesses, a good rule of thumb is several times a week.
Magic in the Facebook metrics
So now you have it, a good overview of what your Facebook metrics mean. Looking for a more in-depth analysis of your Facebook marketing? Give us a call!
