More in our series of updates from our small business social media survey.
Business owners are making a serious investment in social media by spending their time using these platforms. Beyond simply understanding how much time they are spending online, we wanted to see what they are doing with their time.
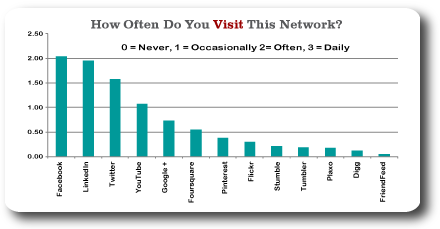
We asked business owners to evaluate how often (0 = Never, 3 = Daily) they used social media for each of the following elements. It is important to note that the study ran from January – March 15, so Pinterest was just breaking on to the scene. I expect it will be a much bigger factor next year.
As in year’s past, Facebook, LinkedIn and Twitter are the dominant networks, absorbing a significant percent of the time spent on site. YouTube and Google+ are starting to gain momentum.
Once active business communities , Friendfeed and Plaxo are now mostly ghost towns.

From the qualitative comments, we picked up a theme of focus and results. When asked what they will do differently this year we heard:
What People Say:
- Focusing on the platforms that drive results.
- More time spent on fewer mediums.`
We will have results from the complete study next week. Would you like us to send you a copy? Simply fill out the information below. And in the meantime, you can listen to Allison and I chat about the survey results on this week’s episode of More than a Few Words
Want a copy of the full report? You can get it here
